Dashboard For Department Operation
Project Description
Stack: CSV . SQL · Power BI
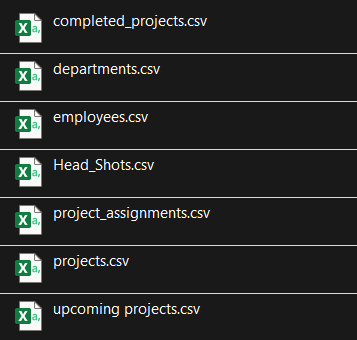
This project delivers a comprehensive, executive-ready view of department budgets and project spending. I started by consolidating data from several CSV files (completed_projects, upcoming projects, employees, departments, project_assignments, and Head_Shots) into a single, clean model using SQL. The unified dataset powers a Power BI dashboard that helps leadership track spend, compare departments, and prioritize investments.
What the dashboard shows
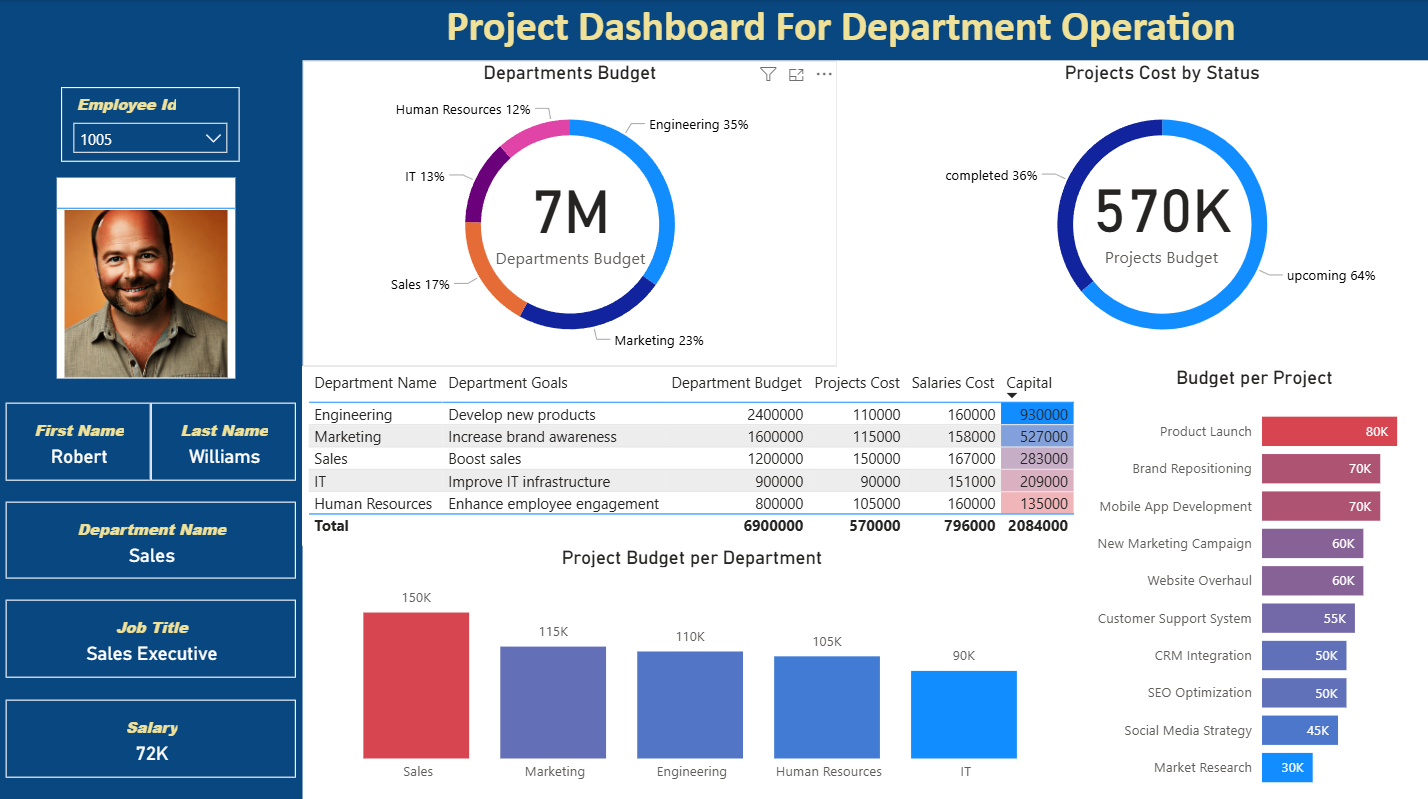
• Departments Budget: a ring chart summarizing total department budgets (7M) with the split by department.
• Projects Cost by Status: current spend (~570K) with completion mix (≈36% completed vs. 64% upcoming).
• Detailed table by department: department goals, budget, project cost, salaries, and capital.
• Budget per Project: ranked bars for initiatives such as Product Launch, Brand Repositioning, Mobile App Development, and more.
• Project Budget per Department: comparative bars to quickly spot outliers across Sales, Marketing, Engineering, HR, and IT.
Outcome & value
The solution centralizes scattered operational data, reduces reporting time, and enables data-driven decisions on budget allocation and project prioritization. Stakeholders can filter by employee/department and immediately see budget usage and status.
Project Screenshots
📌Row Data Screenshot
📌 Dashboard Screenshot
💻 SQL Project Code